Chromium Step-by-Step Command Palette Sequence
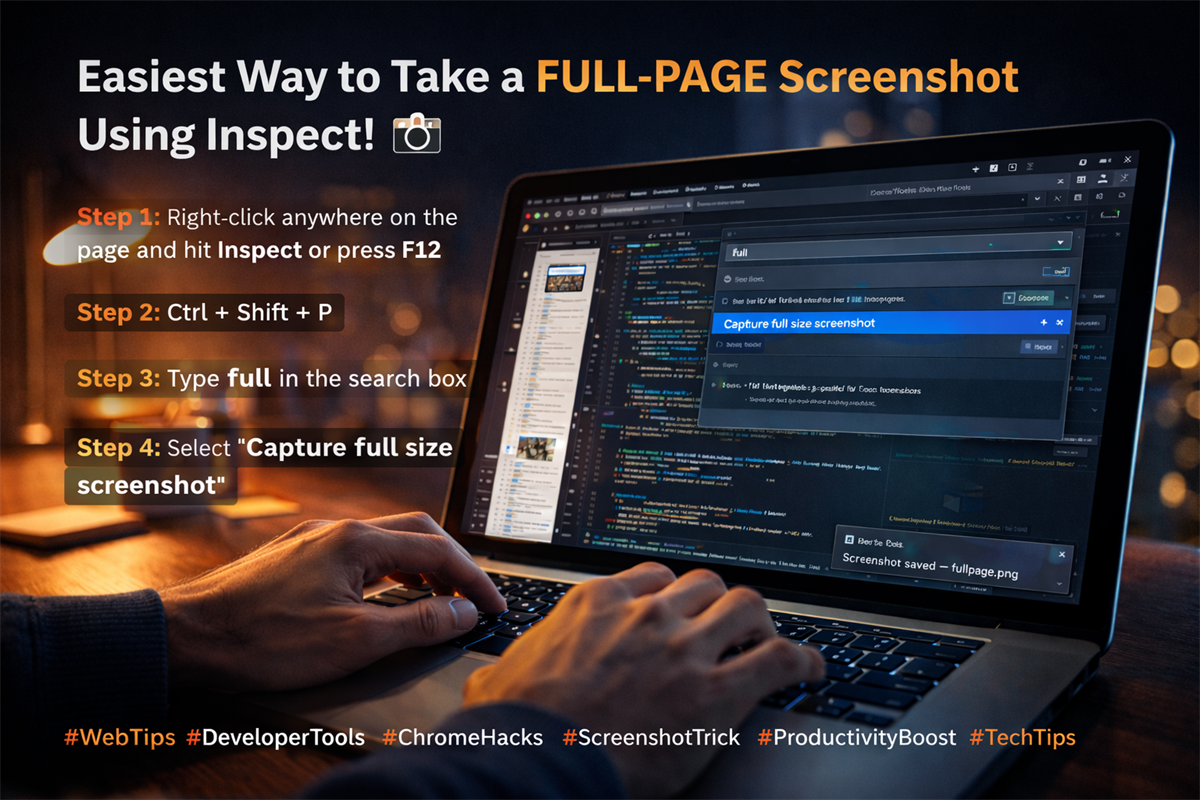
Whether you are on Google Chrome, Microsoft Edge, Brave, or Chromium, native full-page capture requires only four keystrokes:
- Inspect the Target: Right-click anywhere on the webpage and select Inspect, or press F12 (alternatively Ctrl + Shift + I on Windows / Linux, Cmd + Option + I on macOS).
- Open the Command Palette: Press Ctrl + Shift + P (Cmd + Shift + P on macOS) to open the DevTools command launcher.
- Search the Command: Type full or screenshot in the search prompt.
- Execute Full Page Capture: Select Capture full size screenshot and press Enter.
Your browser instantly computes the total scrollable DOM height, renders every off-screen section in memory, and triggers an uncompressed high-resolution PNG download directly to your default downloads directory.
Why Native DevTools Surpasses Browser Extensions
Security professionals and developers avoid commercial screenshot extensions for critical operational reasons:
- Zero Security Risk: Extensions often demand "Read and change all your data on all websites" permissions, exposing session tokens, cookies, and internal IP ranges to third-party code.
- Deterministic Rendering: Browser extensions stitch viewport viewports sequentially, often duplicating sticky navigation headers, glitching parallax sections, or tearing during scroll animations. DevTools renders the DOM layout tree directly.
- Offline & Lab Compatible: Operates reliably inside air-gapped lab subnets, internal intranet portals, and localhost dev environments without Internet access.
4 Specialized DevTools Evidence Capture Modes
| Capture Mode | How to Trigger | Ideal Operational Use Case |
|---|---|---|
| Full Size Screenshot | Command Menu → Capture full size screenshot |
Archiving complete web pages, legal proofs, and full blog writeups. |
| Node Screenshot | Right-click DOM element in Elements → Capture node screenshot |
Isolating a single bug, vulnerability alert, table, or modal dialog without cropping. |
| Area Screenshot | Command Menu → Capture area screenshot |
Selecting an exact rectangular coordinate crop with pixel coordinates. |
| Responsive Device Mode | Ctrl + Shift + M → Set device → Full screenshot | Simulating iPhone, Android, or tablet viewports before triggering capture. |
Headless Terminal Screenshot Commands
For automated audit scripts, penetration testing pipelines, or CI/CD documentation builds, you can invoke the Chromium rendering engine headlessly from the command line without opening a browser window:
# 1. Capture full-page screenshot of target URL using Chrome or Edge
PS > & "C:\Program Files\Google\Chrome\Application\chrome.exe" `
  --headless `
  --disable-gpu `
  --screenshot="audit_proof.png" `
  --window-size=1920,1080 `
  https://sagarbiswas-multihat.github.io/

# 2. Automated capture with Microsoft Edge in Linux/WSL or Windows
PS > msedge --headless --screenshot="report.png" --window-size=1440,900 https://example.com
Forensic Evidence Documentation Tips
- Pre-scroll Dynamic Single Page Applications: If a web page uses lazy-loading or dynamic image fetching, scroll from top to bottom once prior to capture so all DOM assets load into memory.
- Hide Fixed/Sticky Navbars: If a sticky navbar duplicates across sections, select the header in the Elements inspector and press H to temporarily hide it before capturing.
- High-DPI Capture: In DevTools Device Toolbar, set the Device Pixel Ratio (DPR) to
2.0or3.0to capture ultra-crisp Retina screenshots for executive reports. - Firefox Alternative: In Mozilla Firefox, right-click the page and select "Take Screenshot", then click "Save full page".
Quick Reference Shortcut Matrix
| Action | Windows / Linux Shortcut | macOS Shortcut |
|---|---|---|
| Open DevTools Inspector | F12 or Ctrl + Shift + I | Cmd + Option + I |
| Open DevTools Command Menu | Ctrl + Shift + P | Cmd + Shift + P |
| Toggle Mobile Device Emulation | Ctrl + Shift + M | Cmd + Shift + M |
Field Manual Utility: Recommended for vulnerability reporting, interface quality assurance, and legal evidence archival.